
A Stunning Animation of a Solar Flare
Author: 一毫秒的永恒
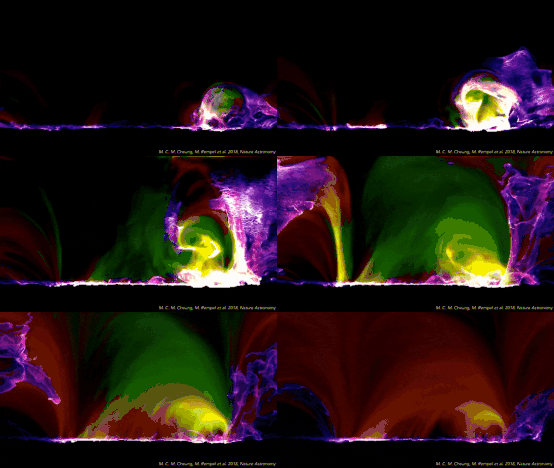
This animated visualization models the life cycle of a solar flare in three dimensions, using different colors to show the temperatures reached during the eruption. The magnetic-field lines dance: first they surge, then erupt, and finally settle down. Beyond producing a striking view of a solar flare, the simulation lays important groundwork for predicting flare activity in space weather.
Solar flares are the most powerful explosions in our solar system—and spectacular events to behold. They form near sunspots, the dark patches on the Sun’s surface that are cooler than the churning plasma around them. According to NASA, sunspots form where strong magnetic fields suppress convection, cooling the local region. Loop-shaped flare structures appear when stored energy is suddenly released at the solar surface. To model a flare from beginning to end, the researchers had to calculate the energy required for one to form across the simulated region. They reported that their model extended more than 6,000 miles (10,000 kilometers) below the Sun’s surface and nearly 25,000 miles (40,000 kilometers) above it, reaching into the corona. Once they had set up the solar simulation, they let the model evolve on its own to see whether a flare would emerge naturally.
It did.
Although solar flares occur about 93 million miles (149 million kilometers) from Earth, they can have major effects here. Flares are sometimes accompanied by intense solar storms that hurl large quantities of charged particles and plasma into space. When that material interacts with Earth’s magnetic field, it can trigger geomagnetic storms that disrupt communications networks, power systems, and satellites. Solar storms may also interfere with animals that use Earth’s magnetic field to navigate, including migrating whales.
References
 爱发电(点击图片跳转)